
A digital twin connects sensor data with a computational model of a structure. It is not a visualization. It is a tool that shows a structure’s current state and predicts its behaviour in real time.
We operate digital twins for two dams today — Dalešice and Bystřička. The same principle of integrating monitoring data into a digital twin also applies to other structures — bridges, tunnels, high-rise buildings, wind turbine towers or just their blades — and to machines, from turbines in hydro, wind and nuclear power plants to aircraft jet engines.
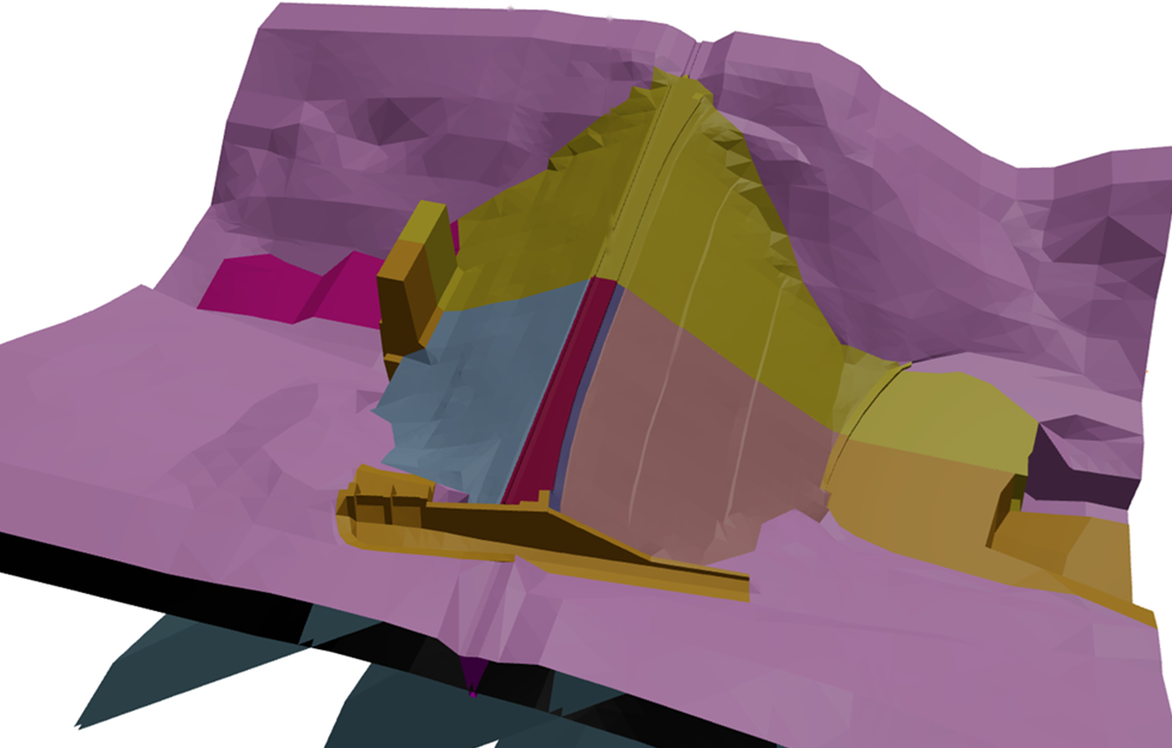
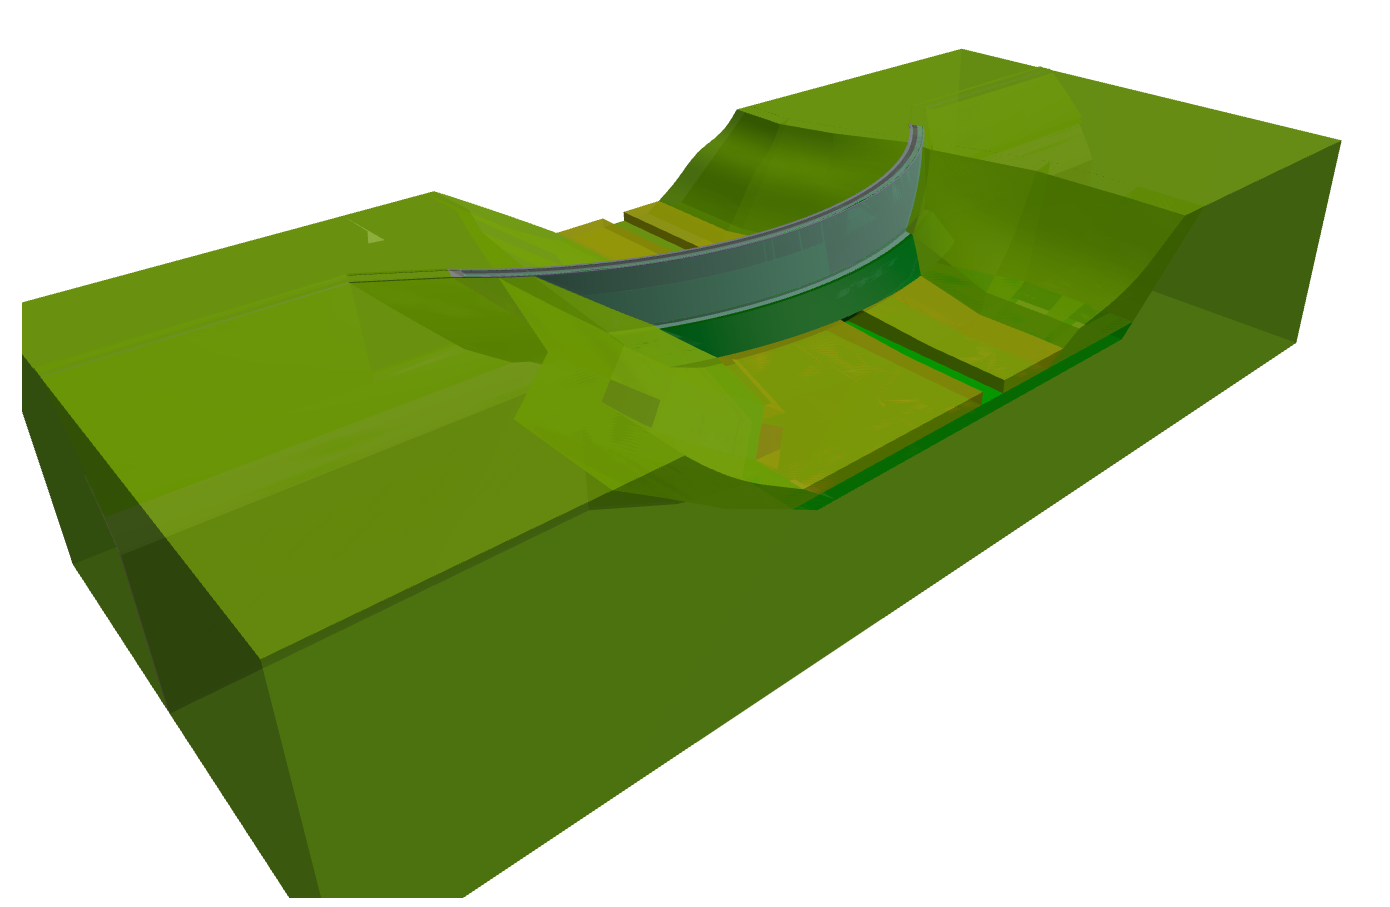
Dalešice dam
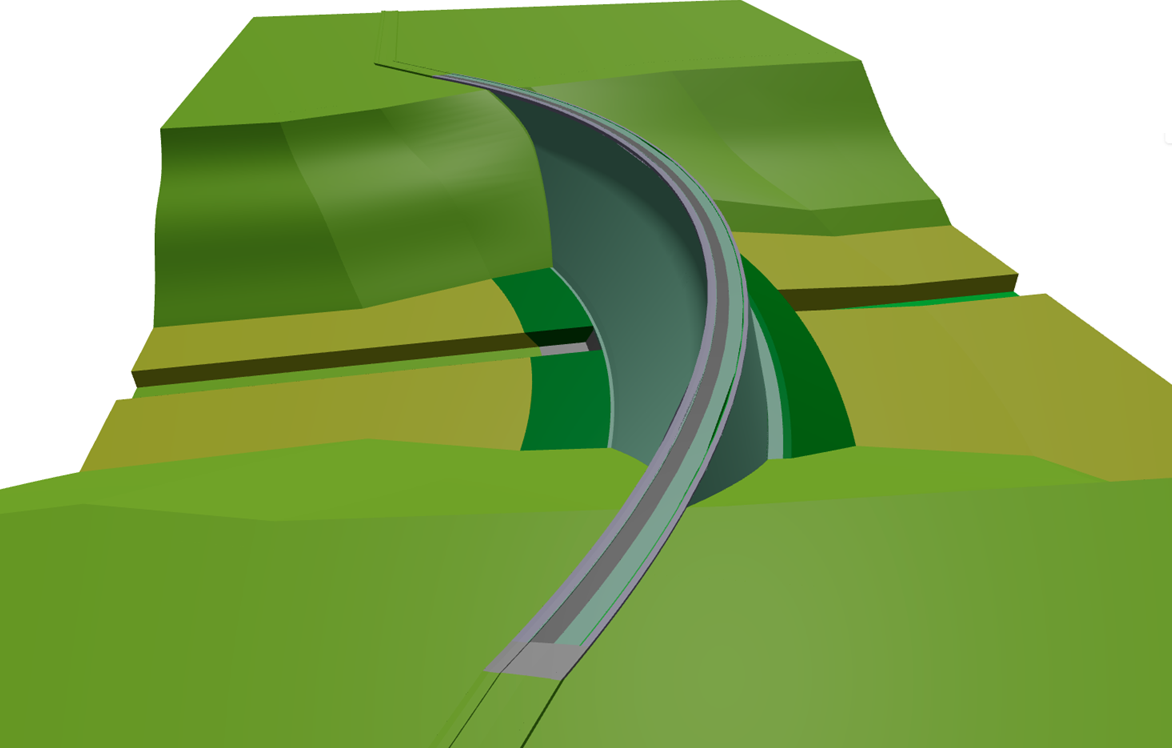
Bystřička dam
When a digital twin makes sense
A digital twin isn’t the right solution for every structure. It makes sense if one of these situations applies:
- you have monitoring in place, but the data is only used retrospectively — you react to changes in structural behaviour with a delay
- maintenance or operational decisions are made without quantification — making them hard to justify afterwards
- a FEM model of the structure exists but isn’t used operationally — monitoring data and simulation live separately
- the structure is ageing or operating conditions have changed — and you need to quantify the change in behaviour, not just estimate it
- you want to shorten the gap between a change in structural behaviour and the moment you know about it
In practice, this means: earlier detection of changes in structural behaviour, less reliance on manual data evaluation, better grounds for decisions on interventions or operating restrictions.
Do you have a structure with monitoring that only collects data today? Describe it and we’ll tell you if a digital twin makes sense for your structure.
How it works
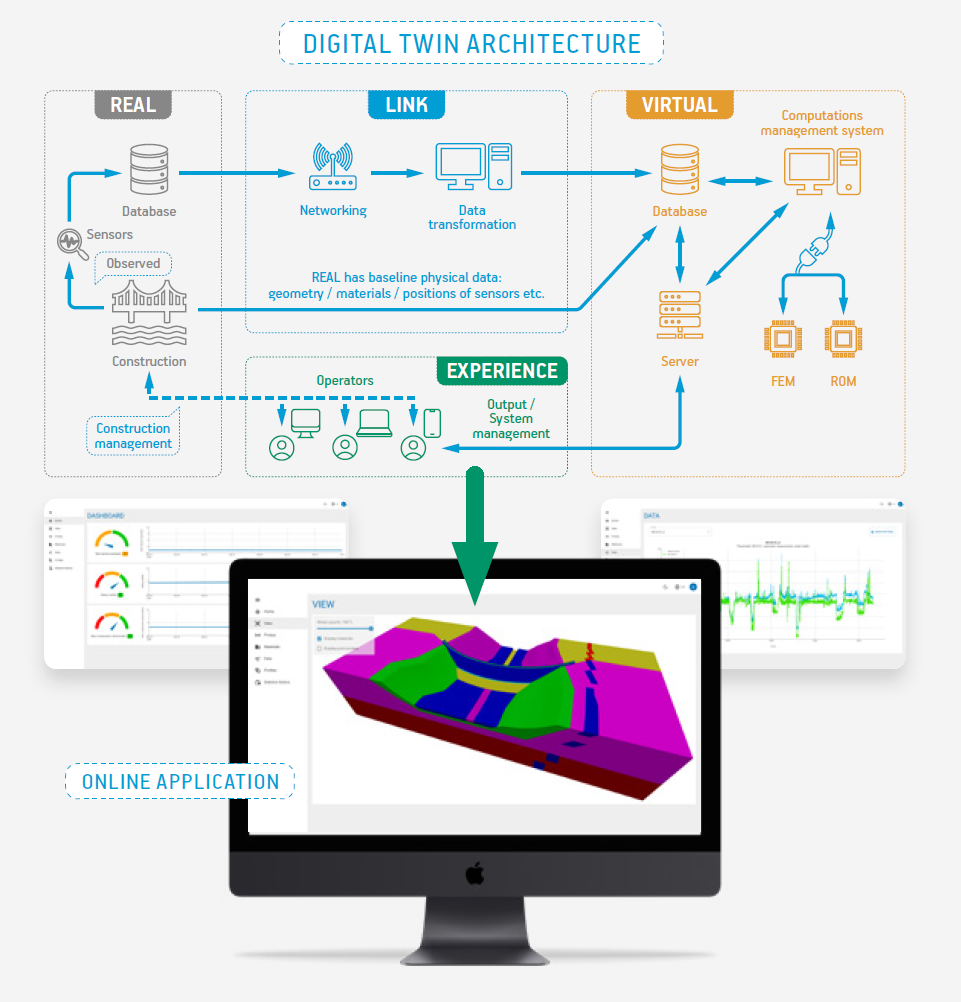
The platform connects monitoring, the computational model and the operational application into a single workflow. The principle rests on four connected layers:
- REAL — the physical structure and sensors that measure real behaviour (displacement, seepage, piezometric head and other quantities depending on the structure type)
- LINK — transfer and transformation of measured data into the platform’s database
- VIRTUAL — the computational core: a numerical FEM model or a machine-learning model — occasionally both combined — that predicts the structure’s behaviour in real time
- EXPERIENCE — the web or mobile application where you monitor the structure’s state, scenarios and outputs
Interested in what this architecture would look like for your structure? Send us its parameters and we’ll design an architecture tailored to it.
What’s behind it
The four layers aren’t a PowerPoint architecture — there’s a system behind them that runs today.
On the REAL side, we work with dozens of sensors on a single structure — displacement, pore pressure, seepage, flow, and additional quantities like rainfall or temperature that feed into the model as context. For each measured quantity, we set the sampling frequency and how quickly the data must reach the model — some feed it within minutes, others once a day.
On the VIRTUAL side, we assign a model to each monitored quantity based on the nature of the data — from a numerical FEM model to machine-learning models that include additional inputs such as rainfall.
On the EXPERIENCE side, we set up accuracy checks for each model, comparing its prediction against real measured data over a defined time window. This applies to live predictions — virtual what-if scenarios aren’t checked against reality, since there’s no measured counterpart to compare against.
Want to know what type of model would make sense for your sensors? Tell us what you measure and we’ll tell you.
What you don’t need
- A new monitoring system — if you already operate one, we connect to it
- A complete FEM or machine-learning model of the structure — we can start primarily from measured data and add the model later
- A change to your existing operating workflow — the platform supports decision-making, it doesn’t replace your processes
From data to 3D visualization
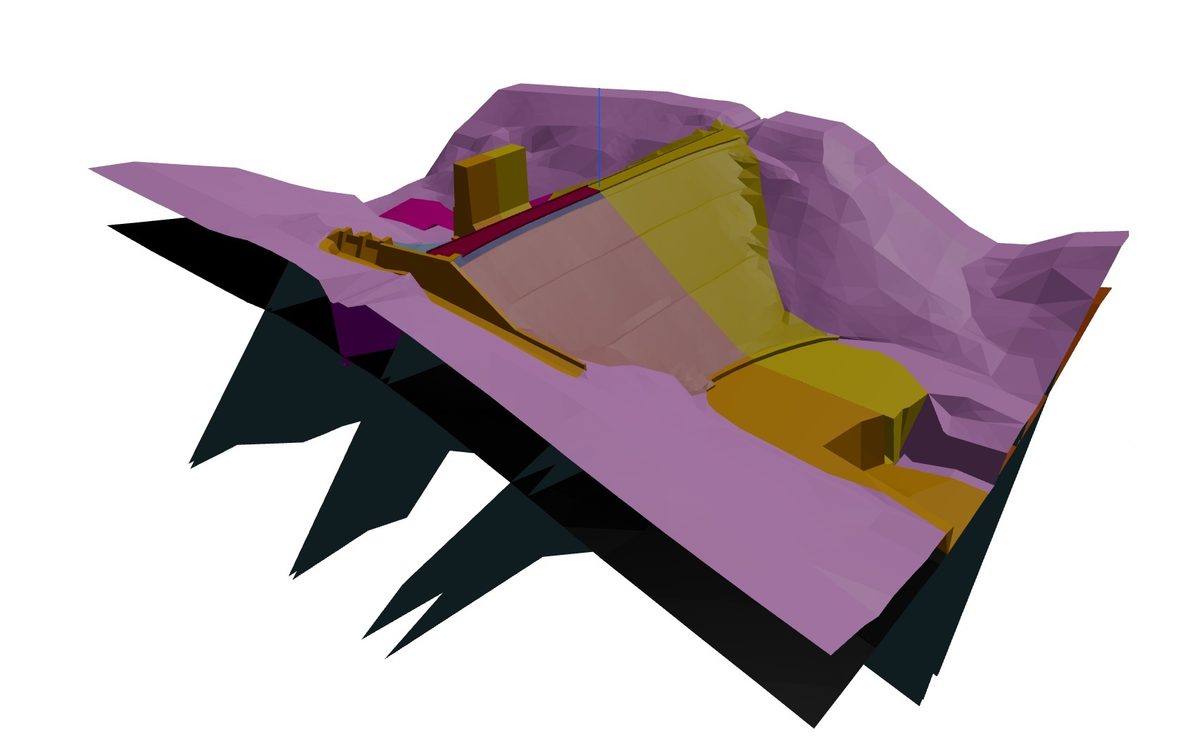
The platform’s output isn’t just a chart or a table of numbers. The structure’s numerical model is also available as an interactive 3D visualization, showing the structure’s geometry and sensor positions in one view. The visualization and the calculation models are separate — the FEM or machine-learning model behind the scenes runs its calculations independently of the 3D geometry. A machine-learning model, in particular, doesn’t use geometry data at all.
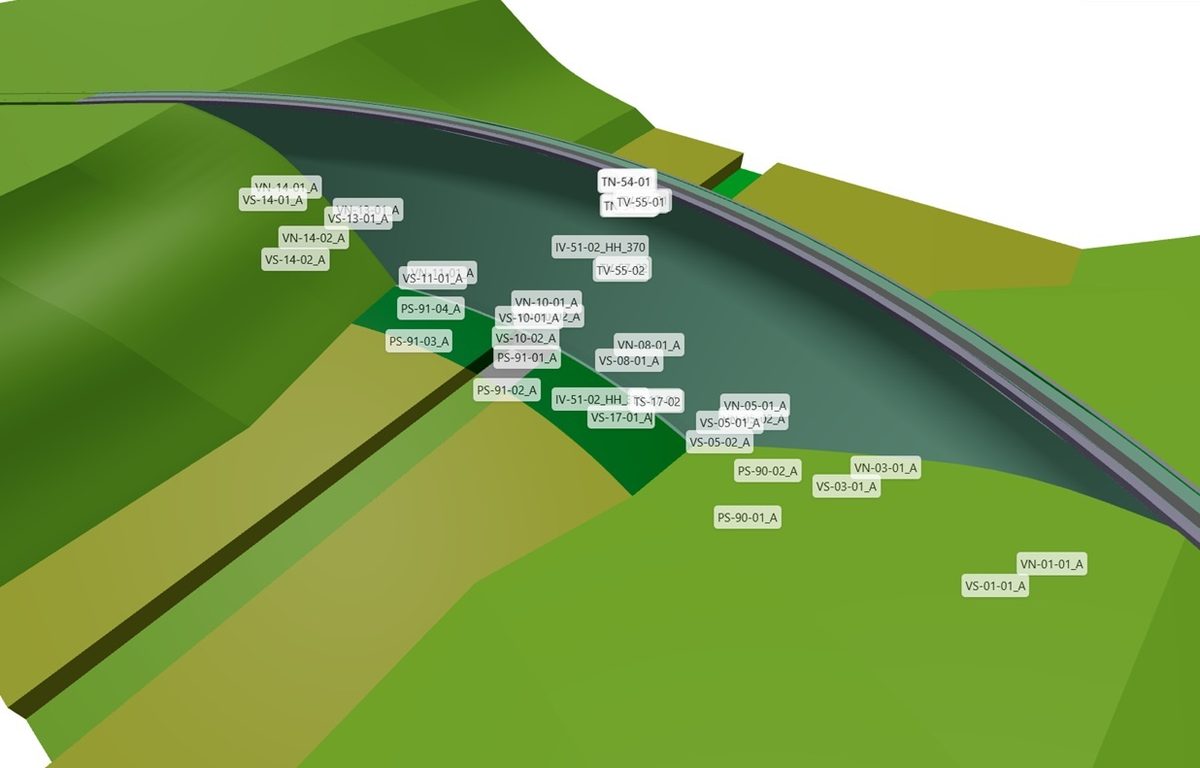
Want to try out how the visualization works on a specific case? Send us a data sample and we’ll prepare a demonstration based on your case.
What happens if you decide to move forward
- Data assessment — we look at what data you have and whether it’s sufficient for a digital twin
- Architecture design — we design what the REAL–LINK–VIRTUAL–EXPERIENCE layers would look like for your structure
- Pilot on a data subset — we set up and verify the model on a selected data sample, so you can see real accuracy before committing to full deployment
- Deployment — the digital twin goes live, with access to the platform
We’re looking for projects where it makes sense to move from monitoring data to using it for decision-making — dams, bridges, tunnels, high-rise buildings, wind turbine towers or just their blades. Also machines, from turbines in hydro, wind and nuclear power plants to aircraft jet engines.
From your side, we need measured data and an online connection to our platform. We take care of the rest — data processing, modelling and deployment.
Give us data. We take care of the rest.
Two dams, two different operating contexts
Both dams below went through this process — from data assessment to a live deployment. The platform is in operation on two real water structures with different purposes and structural characteristics.
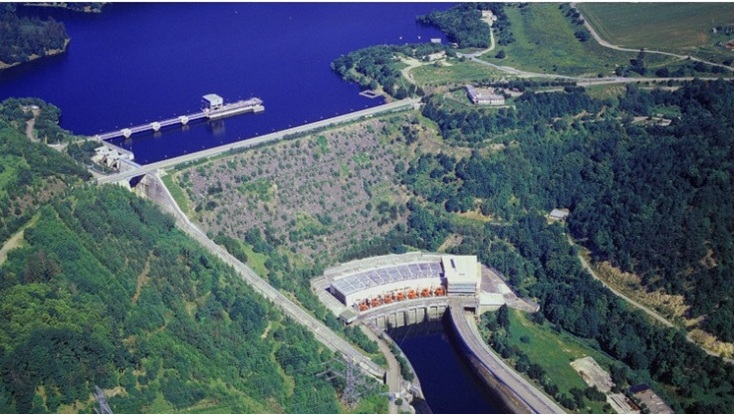
Dalešice dam
A pumped-storage hydroelectric plant on the
Jihlava river (1970–1978). Arch dam, height approximately 100 m, length 350 m, reservoir
volume over 127 million m³. Main functions: supplying the Dukovany nuclear power plant with process water, electricity generation, and flood protection downstream of the dam.
Bystřička dam
One of the oldest dams in the Czechia (1907–1912). Masonry dam built from quarried stone, height approx. 37 m, length 170 m, reservoir volume around 5 million m³. Main functions: flood protection, flow regulation and recreation. We built its digital twin in partnership with the CREA Hydro&Energy cluster and
Vodní díla – TBD.
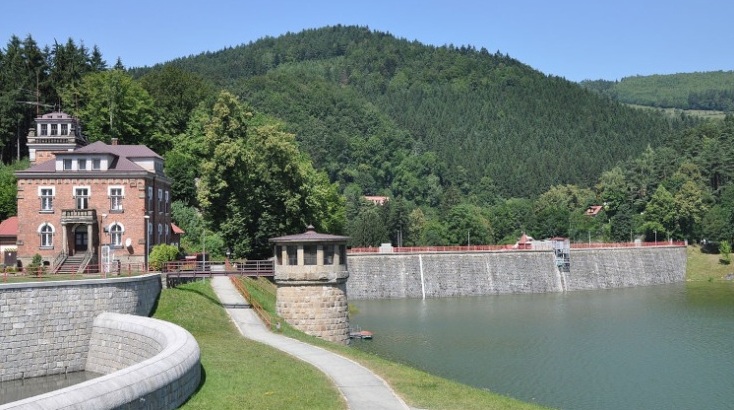
The differences in age, structural type and operating purpose between the two dams show that the approach works across different types of water infrastructure — from a century-old masonry dam to a modern energy facility.
Operating a similar structure and want to know if a digital twin would pay off? Describe it and we’ll assess it.
Frequently asked questions
These are the questions structural engineers and asset managers ask most often before starting a digital twin project: what data you need to provide, whether your existing sensor setup is enough, how long deployment actually takes, and how much of your team’s time it requires once the platform is live. Answered directly,
without sales language.
How much data do we need for a first model?
It depends on the model type — its complexity and data characteristics. Machine-learning models need historical data — typically several months as a minimum, ideally several years covering different operating conditions and seasons. A FEM model doesn’t rely on historical measurements the same way — it’s built from geometry and material parameters instead.
What data do you need to build a digital twin of our structure?
The foundation is measured sensor data and an online connection to our platform. If geometry and material parameters of the structure are also available, we use them for a more precise FEM model; without them, we can work primarily from measured data.
How long does it take to deploy a digital twin?
It depends on the scale of the structure, the number of sensors and the quality of historical data. Simpler structures with good-quality data are handled within weeks; larger structures with more complex modelling take a few months.
Do we need to install new sensors on the structure?
Not necessarily. If you already have monitoring in place, we can connect to the existing data. New sensors are only recommended where coverage of key variables is missing.
Does this work for other types of infrastructure besides dams?
Yes. The principle of combining monitoring with a FEM model or a machine-learning model also applies to other structures and machines — bridges, tunnels, buildings, wind turbines, or rotating machinery like turbines and jet engines. The specific setup depends on the type of structure and the data available.
How much effort is required on our side?
The main work on your side is a one-time connection of data to our platform. Once it’s live, your team’s involvement is minimal — operation, calibration and model updates run on our side.
Didn’t find the answer you were looking for?
Feel free to contact us. We’ll tell you whether we can help
and if we can’t, we’ll tell you that too.